Browse
Pedagogical Design
Posted on: Help and Support Group

PEDAGOGICAL DESIGN
What is the #iteachmsu File Management Policy?
What is the document retention policy?
The recommended approach for sharing articles and posts on the #iteachmsu Commons is to save important information in MSU's Google Drive, OneDrive, SharePoint or your department's internal document server before sharing your documents or articles on the commons.
The #iteachmsu Commons is designed for sharing information, connecting and collaborating with other educators around those ideas. The above-mentioned systems already have robust document retention and versioning functionality.
Check the following links for more information:
Google Drive
Spartan Drive ( This is the MSU branded Office365 environment.You will find OneDrive and SharePoint after authenticating with your MSU NetID to the Spartan Drive portal)
Image: "files" by tom_veatch is licensed under CC BY-NC-SA 2.0
Authored by:
Rashad Muhammad

Posted on: Help and Support Group
What is the #iteachmsu File Management Policy?
What is the document retention policy?
The recommended appro...
The recommended appro...
Authored by:
PEDAGOGICAL DESIGN
Tuesday, Dec 3, 2019
Posted on: Creating Equitable Instruction through Universal Design for Learning

PEDAGOGICAL DESIGN
Dilemmas with Alternative Text
Alternative Text
Alternative (alt) text describes visual images or objects within the context that they appear. It helps individuals that rely on assistive technology, such as screen readers to understand the provided content. A good description of an image or table can also help all students understand the purpose of the content and begin to practice viewing images and tables as experts.
It may sounds like a simple process of describing an image, but depending on your content (graphic, animation, or table) or the purpose of your content, generating alt text can be challenging.
In addition to providing alt-text resources below, we have compiled some alt text related experiences from faculty. We asked what challenges they have faced surrounding alt text in their academic content, what they have done to tackle these challenges, and what resources they would like to see to help with alt text concerns. Please share your own challenges or solutions in the comments!
Who are We?
We are the Accessible Course Design Learning Community. We are a group of faculty and staff that meets once a month and takes a practice-based approach to exploring accessibility and Universal Design for Learning.
Alt-text Resources
The DigitalX Team at MSU has created tutorial about adding alt text to images, charts, and graphs
Microsoft Word
Microsoft PowerPoint
Tips for creating meaningful alternative text from WebAIM
The Diagram Center is striving to ensure that accessible educational material is created, published and available for all types of disabilities and learning styles
Faculty Experiences with Alt Text
Questions
What dilemmas or difficulties with alt text have you experienced? Are there any important types of images in your field that are particularly tricky to describe? Why?
How have you solved your difficulties/dilemmas (for now)?
Do you feel more is needed? Are there any technologies (real or imagined) that could help?
Casey Henley, Neuroscience & Physiology
My undergraduate course content centers on students analyzing data from primary literature research articles. Alt text has proven to be quite challenging. The simple solution would be to describe the results of the graph, and tell the students the main takeaway message from the graph. However, the skill I am teaching in the course is for students to interpret the data and generate a conclusion on their own.
My current solution is to provide numerical data points. Sometimes this requires a rather detailed table if there are multiple time points and/or multiple experimental groups.
I do not feel my alt text solution gives an equivalent educational experience to students. As an individual without sight impairment, visualizing data in a graph is a completely different, more efficient experience for interpreting data compared to reading a clump of numbers in a table. I believe a technology that could create braille-like representations of the graphs would help the situation. A raised version of the graph could allow individuals to compare bars or lines. However, even this solution might not work for more complex graphs.
Emilia Marcyk, Libraries Teaching & Learning
When I create tutorials with screenshots that show important features of websites or interfaces that students will need to notice in order to complete an assignment, I find it difficult to decide how much alt text to provide. Should I just describe the important features (such as search boxes or menu buttons that the student needs to interact with) or describe everything in the screenshot?
Currently, I provide a link to the active page with the screenshot, and only describe the important features that I am calling out in the screenshot in the alternate text. If the student needs greater context, they can go to the live page.
I would be nice to have the ability to embed directions into the live version of pages, rather than rely on screenshots to emphasize important aspects. There are tools that do this, but I don't have access to them currently.
Heidi Chen, Online Master of Science in Food Safety program
For complicated data graphs, the instructors only talk about what the graph demonstrates or takeaways as Casey mentioned above. For posters we try to describe the content on them but it can get really long
No good solution for screenshots. We try to persuade our instructors to reduce using screenshots.
Scott Mulrooney, Microbiology and Molecular Genetics
In my Introductory Microbiology MMG 301 (enrollment ~500), we use PowerPoint slides containing over 700 images. Almost all of these do not have alternative text, so I added the text to each image. It took several days of being "in the zone" but I got the job done.
As I said, a brute force approach was used to simple get the job done.
Textbook publishers are addressing this issue. I have spoken to several publisher reps and they all say that future editions of their textbooks will address accessibility. The problem I faced was that the edition we are currently using does not have alternative text for its images. In addition, I use images from other creative commons sources that does not have alternative text. I suppose that undergraduates who are very familiar with the subject could enter much of the alternative text. In recording material for online presentations, I do a lot of drawing and creation of diagrams. I am now careful to describe what I am creating as I speak in the recording.
Antoinette Tessmer, Department of Finance
My challenge is in using alt text (or more likely another tool) to describe the content of an Excel sheet. (My course is 100% Excel-based)
I have not found a solution...
I am curious to learn about existing technology that could help.
Anne Violin-Wigent, Romance and Classical Studies
I teach French and teaching methods for foreign language teaching. The main dilemma is that the current methods encourage us to use visuals to present the meaning of new vocab and to avoid the use of English and translations. In addition, when teaching grammar, we highlight endings or whatever grammar point we're teaching so that we can make it salient and help students figure out grammatical rules on their own. For example, we use pink for feminine endings and blue for masculine endings (I know, stereotypical but it's helpful for what we do). Therefore, using alt text may go against the method we use. And I'm not sure how to reconcile this.
For some elements, it's easy to use bold or underline or italics to replace color. But at the same time, sometimes, it feels like something underlined is not as salient as something in bold. I personally like to use bold and color.
We do not get a lot of students who request accessible material in French, and I'm not sure if it's because RCPD waives language requirements for them or because of other reasons. Regardless, I'm working (with a team) on developing new class material, especially the hybrid/online component and I'd love some guidelines.
Authored by:
A11y / UDL Learning Community
Posted on: Creating Equitable Instruction through Universal Design for Learning
Dilemmas with Alternative Text
Alternative Text
Alternative (alt) text describes visual image...
Alternative (alt) text describes visual image...
Authored by:
PEDAGOGICAL DESIGN
Monday, Nov 25, 2019
Posted on: Creating Equitable Instruction through Universal Design for Learning
PEDAGOGICAL DESIGN
Accessibility Checklist for Word Documents
Make Accessible Word Documents
Creating accessible Word documents helps students using screen readers access and navigate your content. Many of these features will also help visual users find what they need in long documents quickly.
Address the five major areas below to make your Word documents more accessible.
All links go to MSU Web Access tutorials, unless otherwise noted.
Who are We?
We are the Accessible Course Design Learning Community. We are a group of faculty and staff that meets once a month and takes a practice-based approach to exploring accessibility and Universal Design for Learning.
Do your Word documents properly use headings?
Use headings to designate major sections of your document. Headings provide context and a way to navigate quickly for users of assistive technologies like screen readers. Well-structured headings also make it easier to generate a meaningful table of contents for your document.
Creating Headings in Microsoft Word
An explanation of heading structure from WebAIM
Do all images use alternative text?
Alternative (alt) text describes visual images, charts or graphs within the context that they appear. It helps individuals that rely on assistive technology, such as screen readers, to understand the provided content.
Adding alt text to images, charts, and graphs in Microsoft Word
Tips for creating meaningful alternative text from WebAIM
Are tables structured properly?
Tables need to be structured properly for the screen readers to navigate correctly. That usually means designating header rows, so users can understand what information is in each table cell. Well-structured tables also help visual users understand your data.
Creating Table Headers from Microsoft Office support (Windows)
Creating Table Headers from Microsoft Office support (Mac)
Are lists structured properly?
Lists items must be in a Word-formatted numbered or bulleted list so that they are grouped together for users of assistive technologies. Using list formatting also lets you quickly change the style or appearance of your list.
Using list styles in Microsoft Word
More information about lists from WebAIM
Do hyperlinks provide context to the user?
People who use screen readers sometimes scan a list of links. Links should convey clear and accurate information about the destination. Avoid the dreaded "click here!"
How to create links in Word from Microsoft Office support
Tips for creating meaningful links from WebAIM - this is about links more generally (not just about Word), but provides detailed information about how to use links effectively
Other considerations
Text should have a strong contrast against the background. You can use color contrast checkers to test your colors. WCAG 2.0 requires a contrast ratio of 4.5:1.
Avoid using repeated blank characters, like carriage returns between paragraphs, to create white space. Use text spaces practices instead.
Avoid "floating" images, charts, or other objects. Floating occurs when an object is not "inline" with the text, so the text either wraps around the objects or appears behind or in front of the object. To correct this, right click on the object, choose "Wrap Text" from the menu, and choose "In Line with Text."
Interested in learning more?
Visit the Create more accessible Word documents training series by Microsoft.
Authored by:
A11y / UDL Learning Community
Posted on: Creating Equitable Instruction through Universal Design for Learning
Accessibility Checklist for Word Documents
Make Accessible Word Documents
Creating accessible Word documents h...
Creating accessible Word documents h...
Authored by:
PEDAGOGICAL DESIGN
Monday, Nov 25, 2019
Posted on: #iteachmsu
PEDAGOGICAL DESIGN
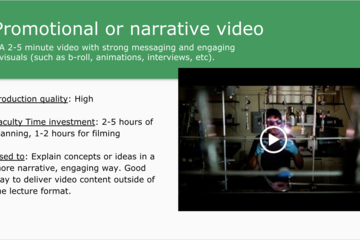
Video Production Menu for Online Teaching
During the last two years of work with the College of Engineering to bring Electrical and Mechanical Master's programs online, we created a video production "menu" as a helpful tool for faculty. We presented them with this document early into course development so they could see examples of different videos they could create for their online courses. This helped provide them with ideas of different video styles so they had options and could make things to their own workflow preferences. Additionally, this gave them a good idea of what our quality standards were so students had a good online experience.
https://docs.google.com/presentation/d/1bPScf--8neBrByMliQwZnW5e-4SPoFhXnqwMuQFVHbU/edit?usp=sharing
https://docs.google.com/presentation/d/1bPScf--8neBrByMliQwZnW5e-4SPoFhXnqwMuQFVHbU/edit?usp=sharing
Authored by:
Alyssa Bradley
Posted on: #iteachmsu
Video Production Menu for Online Teaching
During the last two years of work with the College of Engineering t...
Authored by:
PEDAGOGICAL DESIGN
Friday, Nov 22, 2019
Posted on: #iteachmsu
PEDAGOGICAL DESIGN
Online Course Design Case Studies
Earlier this year, I posted on the Hub blog about our experience working with faculty to put their courses online. I shared an infographic of two case studies of how faculty had decided to build their online courses.
Authored by:
Breana Yaklin
Posted on: #iteachmsu
Online Course Design Case Studies
Earlier this year, I posted on the Hub blog about our experience wo...
Authored by:
PEDAGOGICAL DESIGN
Friday, Nov 15, 2019
Posted on: #iteachmsu Ambassadors
PEDAGOGICAL DESIGN
Storytelling for Learning 1: Creating Meaning from Chaos
Storytelling for Learning 1: Creating Meaning from Chaos
In 1944, experimental psychologists Fritz Heider and Marianne Simmel used the video below in an experiment. They instructed their female undergraduate subjects to write down what happened in the movie.
I want you to do the same. Take out some paper, watch the video, and jot down a few sentences about what happened.
What did you write down? What was happening?
Now watch part of the video below, where some comedians talk about what they saw. You only need watch about a minute of the video to get the idea. (Warning: potentially offensive language...as you can imagine from comedians on YouTube.)
What is interesting is most people create a story. The characters are a shape. There is a setting of a room, or perhaps a house. Many people see a bullying event, or another form of conflict.
Yet this is simply a video of shapes moving around a screen, isn't it?
Humans are wired to create meaning from input. That is why my aunt sees Jesus in her toast. That is why, when the photo below was taken by NASA in 1975 (yes, that is a real and unedited photo), the public FREAKED out. A face! A human face! There is life there! They are communicating with us!
It is also why we love conspiracy theories. When random things happen, especially bad things, we want a logical explanation. Random bad luck is not an explanation that satisfies us. Thus, Elvis didn't die young. Nope. He faked his death to live in peace, away from the nuisance of fame. Now he is in hiding-- living out his years in a lovely coastal fishing village in Honduras.
p>Daydreaming is, for the most part, storytelling. It is us thinking about a possible scenario, planning something in the future and creating the "story" that surrounds it, or just fantasizing about something other than where we are at the moment.
How many waking hours do you spend each day daydreaming?
2-3 hours
3-5 hours
5-7 hours
over 9 hours
Created with QuizMaker
So what is the correct answer to the above? Scroll down.
And down!
We spend 7.7 hours each day telling ourselves stories. That’s about half of our waking hours. And then we sleep. And tell stories in our dreams.
Authored by:
Anne Baker

Posted on: #iteachmsu Ambassadors
Storytelling for Learning 1: Creating Meaning from Chaos
Storytelling for Learning 1: Creating Meaning from Chaos
In 1944, e...
In 1944, e...
Authored by:
PEDAGOGICAL DESIGN
Tuesday, Nov 5, 2019
Posted on: #iteachmsu Ambassadors

PEDAGOGICAL DESIGN
Storytelling for Learning 3: Changing Beliefs and Actions
Changing Beliefs
Stories have the power to persuade. Let's look at advertisements, which sometimes follow a story-like narrative structure. Researchers Quesenberry and Coolsen (2014) asked the public to rate 108 Superbowl commercials from the 2010 and 2011 Superbowls. They then coded the commercials to designate if they followed a dramatic structure or not. I think you already guessed that overall, commercials that were stories were favored over those that were not.
Advertisers want to persuade you. Stories help them to achieve this.
And what is more powerful than changing someone's mind?
How about letting someone believe the conclusion you want them to come to is their own?
Stories allow us to communicate and give advice indirectly. They allow the listener to come to their own conclusions- conclusions that the storyteller has the power to guide them to. We can sell our ideas through stories. They also tap into emotions, which even for the most logical person, play a big part in our decision-making.
You can read about how gratitude is important as a motivator at work. But numbers and statistics won't have the same impact as a story about the impact of gratitude, such as the story below.
For more information on this idea of stories for persuasion and real-life examples of how stories can change behavior, see the Harvard Business Review's article, "How to Tell a Great Story."
Changing Behaviors
What scares you more? Be honest.
Jaws?
Highway accidents?
Created with PollMaker
In 1975, a movie changed the way an entire generation viewed swimming in the ocean. Do you ever think about sharks when you are swimming in the ocean? I do. Most people do. Yet in 2018 there was only one fatal shark attack in the United States (University of Florida, 2019). In contrast, about 40,000 died in car crashes (National Safety Council, 2019). Would so many people be scared of swimming in the ocean without the legendary Jaws series? Probably not.
Dr. Joanne Cantor of the University of Wisconsin, Madison, has studied fear reactions from media. She asked students to write about media-produced fright reaction. Movies like Poltergeist and Jaws were at the top of the list for what created a fright reaction. Fiction. Stories that are not very believable.
Jaws was #1 for kids who saw it before age 13. Remember, she was looking at the impact of more than just movies; she was looking at mass media in general. But for 91% of her subjects, fictional sources were the source of their most terrifying memories. Stories have power. They stick with us. They can change our behavior.
Sources:
Cantor, J. (2004). "I'll never have a clown in my house"--why movie horror lives on. Poetics Today, 25(2), 283-304.
Quesenberry, K. A., & Coolsen, M. K. (2014). WHAT MAKES A SUPER BOWL AD SUPER? FIVE-ACT DRAMATIC FORM AFFECTS CONSUMER SUPER BOWL ADVERTISING RATINGS. Journal of Marketing Theory and Practice, 22(4), 437-454. Retrieved from http://ezproxy.msu.edu.proxy2.cl.msu.edu/login?url=https://search-proquest-com.proxy2.cl.msu.edu/docview/1566309050?accountid=12598
Authored by:
Anne Baker

Posted on: #iteachmsu Ambassadors
Storytelling for Learning 3: Changing Beliefs and Actions
Changing Beliefs
Stories have the power to persuade. Let's look at ...
Stories have the power to persuade. Let's look at ...
Authored by:
PEDAGOGICAL DESIGN
Thursday, Oct 24, 2019
Posted on: Help and Support Group

PEDAGOGICAL DESIGN
Reporting technical issues in the #iteachmsu Commons
Whenever new software is released there are always things that got missed or overlooked. If come across functionality that falls into this category, you can report it by clicking on the red Feedback button on the right side of the screen.
The Feedback tools will allow you to rate your level of dissatisfaction and screen capture the error if it is visible and send directly to our developers.
Help us make this site as useful as possible.
Here is a brief tutorial on using the Feedback tool:
The Feedback tools will allow you to rate your level of dissatisfaction and screen capture the error if it is visible and send directly to our developers.
Help us make this site as useful as possible.
Here is a brief tutorial on using the Feedback tool:
Authored by:
Rashad Muhammad
Posted on: Help and Support Group
Reporting technical issues in the #iteachmsu Commons
Whenever new software is released there are always things that got ...
Authored by:
PEDAGOGICAL DESIGN
Tuesday, Sep 24, 2019